
2020 Voters Media Usage Study: Michigan
In February 2020, TVB commissioned Dynata to conduct a study of registered Democratic voters in Michigan to gain an understanding of media usage, and attitudes toward traditional and digital platforms. Over 950 respondents were surveyed and to qualify, each respondent had to be a registered voter and had to have been exposed to any of over 20 media (traditional or digital) in the prior 24-hour period.
Download study | Press Release
Key findings:
- Among Michigan’s registered voters TV has the highest reach of all ad-supported platforms and broadcast TV leads the way (85%) . This was also true for the three major political party affiliations.
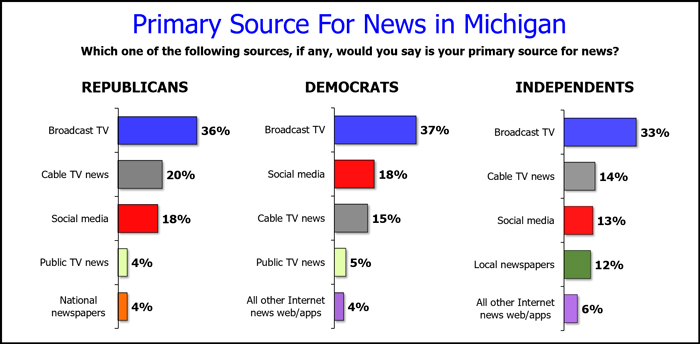
- The primary source for news among Michigan’s registered Republican, Democratic, and Independent voters is broadcast TV, while cable TV news and social media were a distant second and third.
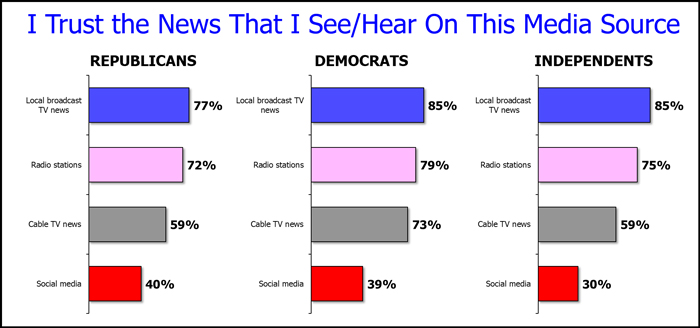
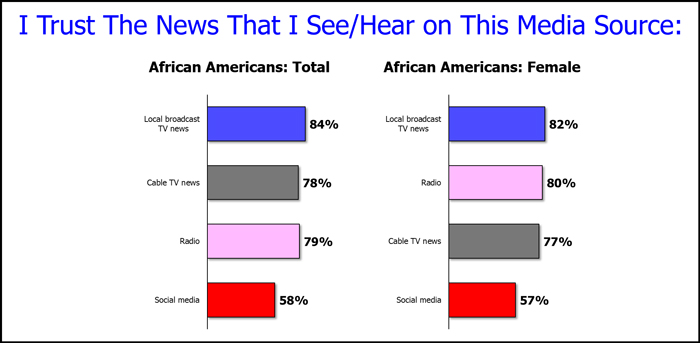
- Republican, Democrat, and Independent voters in Michigan trust local broadcast TV news more than news on radio, cable TV, and social media.
- There is strong concern among African Americans in Michigan about fake news on social media. When asked, 56% of African Americans found fake news to be most prevalent on social media. Only 5% found fake news to be prevalent on local broadcast TV.
- Registered female voters in Michigan’s urban, suburban, and rural areas place far more trust in local broadcast TV news (82%-85%) than news on social media (32%-55%)
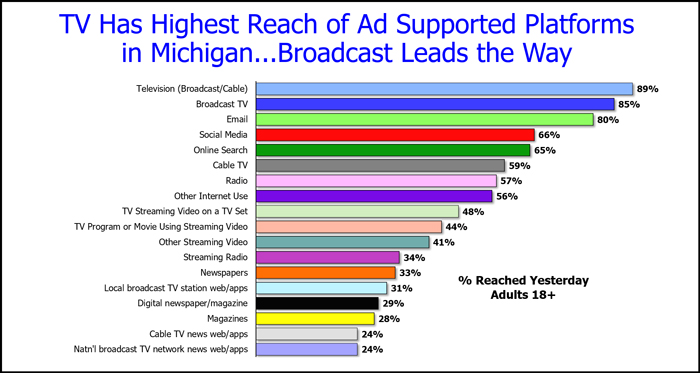
Source: Dynata 2020 Michigan Registered Voter media survey Persons 18+. N = 955
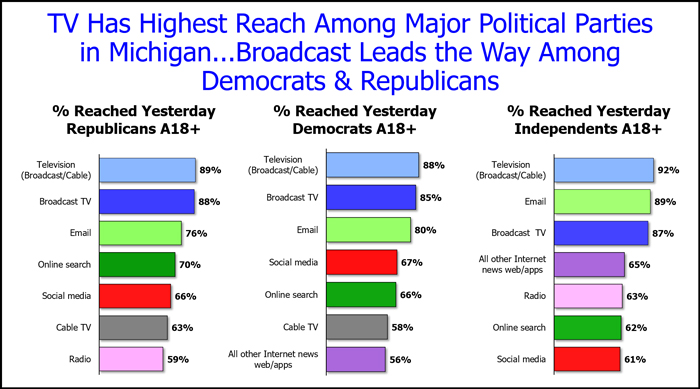
Source: Dynata 2020 Michigan Registered Voter media survey Republicans, N = 123; Democrats, N = 710; Independents, N = 105
Source: Dynata 2020 Michigan Registered Voter media survey Republicans, N = 123; Democrats, N = 710; Independents, N = 105
Q5 – Which one of the following sources, if any, would you say is your primary source for news?
Source: Dynata 2020 Michigan Registered Voter media survey Republicans, N = 123; Democrats, N = 710; Independents, N = 105
Q6 Agree Strongly or Agree Somewhat. For each source, please indicate the extent to which you agree or disagree with the following statement: I trust the News that I see/hear on this media source.
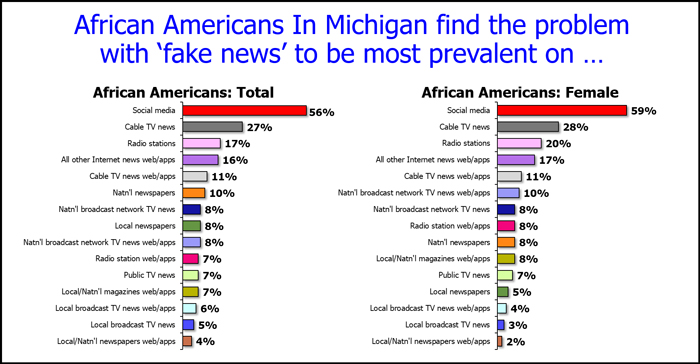
Source: Dynata 2020 Michigan Registered Voter media survey African Americans 18+ Total, N = 134; Female, N = 75
Q7 I find the problem with “fake news” to be most prevalent on…
Source: Dynata 2020 Michigan Registered Voter media survey African Americans 18+ Total, N = 134; Female, N = 75
Q6 Agree Strongly or Agree Somewhat. For each source, please indicate the extent to which you agree or disagree with the following statement: I trust the News that I see/hear on this media source.
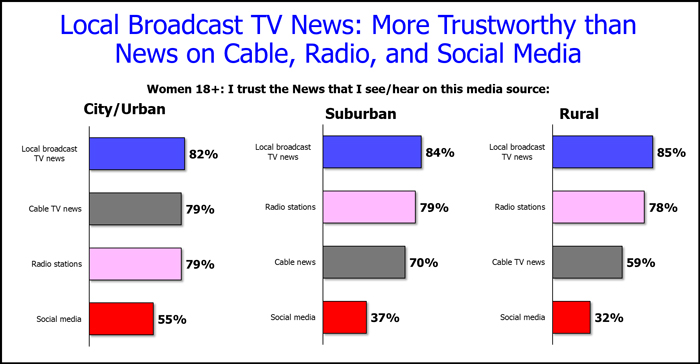
Source: Dynata 2020 Michigan Registered Voter media survey W18+ Urban/City, N = 106; Suburban, N = 251; Rural, N = 130
Q6 Agree Strongly or Agree Somewhat. For each source, please indicate the extent to which you agree or disagree with the following statement: I trust the News that I see/hear on this media source.