
TVB Members: Study PPT will display for download when logged in. Create a TVB member account | Request forgotten password
Television Remains the Most Important Influencer, as Seen in the 2022 Midterm Elections
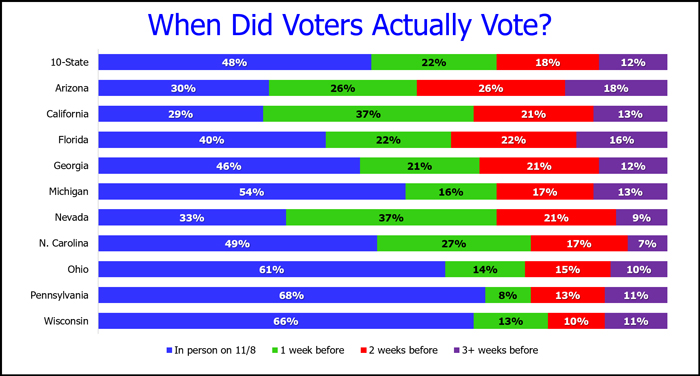
TVB selected 10 competitive states to go into for the 2022 study, including Arizona, California, Florida, Georgia, Michigan, Nevada, North Carolina, Ohio, Pennsylvania and Wisconsin.
The goal of the 2022 Voter Funnel Study was to determine the influence of media platforms on voters’ decision-making process. An online survey administered by Dynata to 10,000 adults (1,000 per state) asked registered voters about their exposure to advertising seen/heard/read on ANY of 20+ media platforms, and what impact it had on them. They did not have to see a TV ad to be included in this study.
The 10-minute survey was fielded right after the polls closed on November 8th, and ran through November 19th, 2022.
A recent TVB analysis of CMAG political spending figures for 2022 (12/27/21-12/4/22) revealed that local broadcast television garnered $1.4 billion in political spending. The ten states selected accounted for 54% of the local broadcast TV total, nearly $730 million dollars, a testament to the states’ competitive nature.
Among the results:
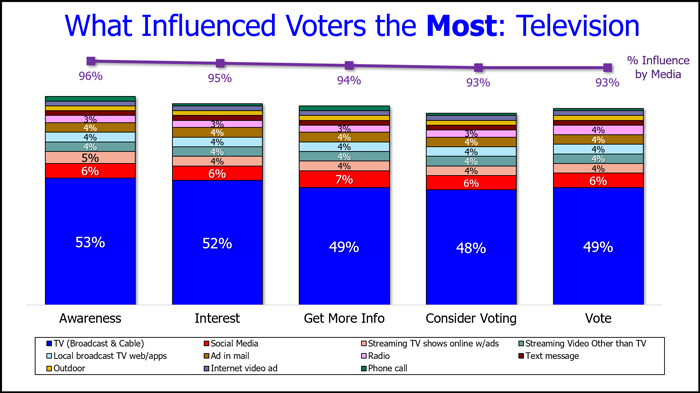
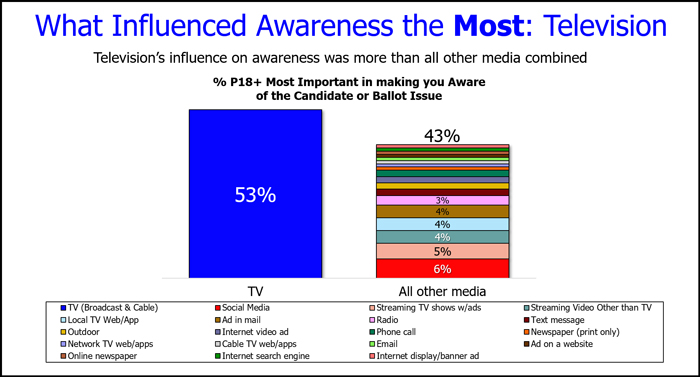
- TV was cited as the most important influence at each stage of voters’ decision process (Awareness / Interest / Get More Information /Consider Voting / Vote). In fact, TV’s influence was more than all other media combined at every stage.
- Of those that cited TV as the “most important”, 7 out of 10 picked broadcast TV over cable.
- TV ads had a ripple effect on 80% of respondents who took some kind of action after seeing/hearing a political ad on television. Additionally, of those that perform online searches, 83% said TV ads influenced their political searches.
- TV news was the most trusted news source while news on local TV station websites and/or apps was the most trusted digital source. Voters found fake news to be most prevalent on social media and cable.
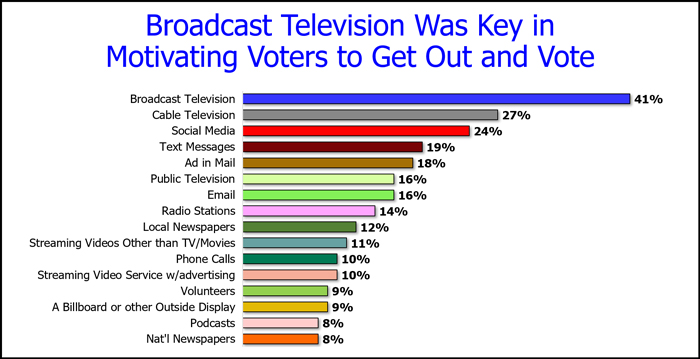
- 41% of voters selected broadcast TV as motivating them to get out and vote. Cable TV was next at a distant 27%, followed by social media at 24%.
- On average, in the 10 states 53% of respondents voted prior to Election Day by mail, drop box or in person (before 11/8/22), an important finding for political campaign managers to factor into their advertising timing/schedule decisions.
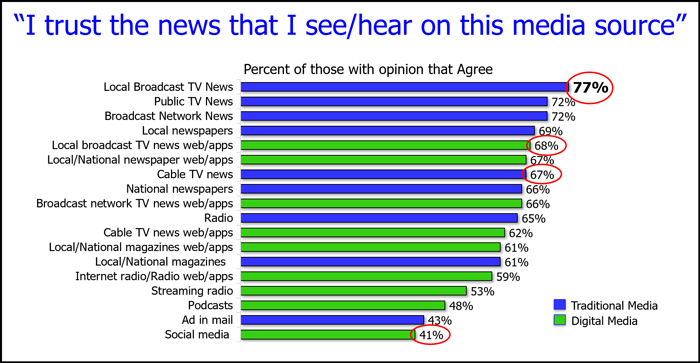
Q6: “For each source, please indicate the extent to which you agree or disagree with the following statement: I trust the news that I see/hear on this media source.”
Q8: “Did you vote?” Of those that voted & Q8a: “How early did you vote, mail in or drop off your ballot?”
For more information, please contact Hadassa Gerber, Chief Research Officer, TVB.