Research
Data-backed insights that prove the power of local broadcast TV.
TVB’s Research hub brings together trusted studies, category insights, and measurement analysis that help advertisers and agencies understand how local broadcast TV drives awareness, consideration, and results. From consumer behavior and media usage to category-specific performance and campaign effectiveness, these resources are designed to support smarter planning, stronger proposals, and more confident conversations with clients.
Find the Resources You Need:
What has been added or updated in the last quarter?
What has been added or updated?
Find the Resources You Need
TVB’s Research hub brings together trusted studies, category insights, and measurement analysis that help advertisers and agencies understand how local broadcast TV drives awareness, consideration, and results. From consumer behavior and media usage to category-specific performance and campaign effectiveness, these resources are designed to support smarter planning, stronger proposals, and more confident conversations with clients.
Studies & Reports

TVB Insights
Nielsen’s Gauge Pie
Broadcast & Streaming

Measurement

Ad Spend & Analytics

Programming
TV Basics
Studies & Reports
Browse key findings and reports that highlight the effectiveness and reach of local broadcast TV.

















TVB Insights
Advertisers & Agencies: Get Insights weekly newsletter.
TVB Members: Get Insights weekly newsletter by creating a member account. Visit My Profile to Manage Newsletter Preferences.
2026 K-12 and college spend
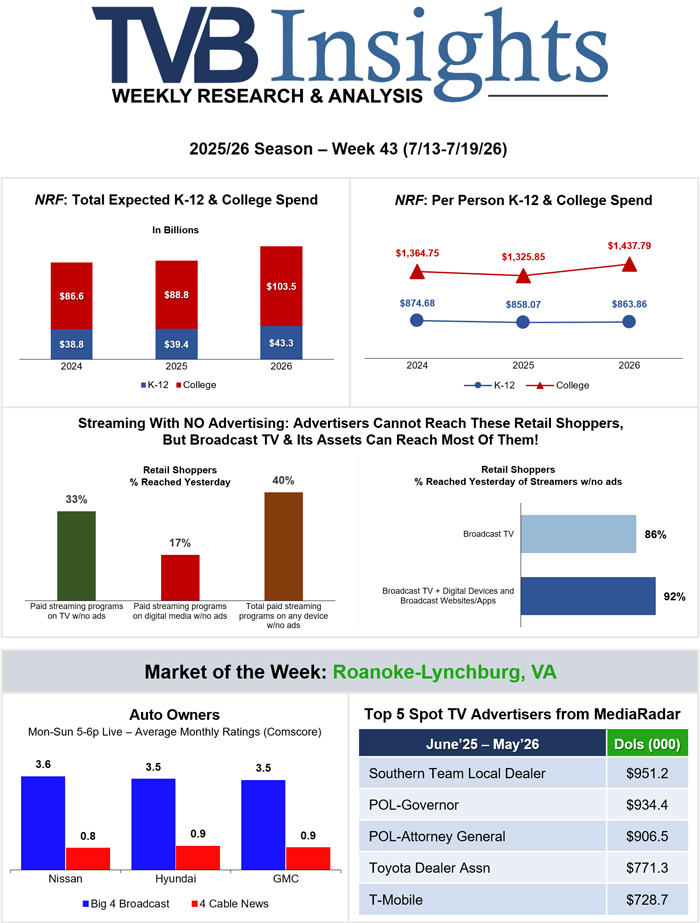
The NRF has released their estimated 2026 spending totals for back-to-school (K-12) and back-to-college shopping. Back-to-school is estimated at $43.3 billion, up 10% from $39.4 billion in 2025, and back-to-college is estimated at $103.5 billion, up 17% from $88.8 billion in 2025. Electronics and clothing/accessories are top categories for both segments. The estimated average per person spend for both is $863.86 for back-to-school and $1,437.79 for back-to-college.
TVB’s 2026 Back to School and College Report has been updated with all this new information. The report also includes insights from TVB’s research on broadcast TV ‘s value to advertisers in reaching retail consumers. For example, we know that 40% of retail shoppers stream programming either on their TV or digital device with no advertising. Advertisers can’t reach those ad free streamers on those platforms but can reach most of them through broadcast TV and its assets. According to the 2026 Media Comparisons Study, broadcast TV alone reached, in one day, 86% of retail shoppers who stream with no advertising. When you add broadcast TV on digital devices and broadcast TV websites and apps to the mix, that number climbs to 92%.
Find it in Research: Looking to see what’s new in the Research section on the TVB site? Check out Research Content Updates, which highlights TVB research content that was updated in Q2 2026.
Our featured market of the week is Roanoke-Lynchburg, VA.
Click here or below to Download PDF
Missed last week’s TVB Insights?
Broadcast & Streaming
Support smarter advertising with side-by-side insights into broadcast and streaming trends, viewer habits, and cross-platform strategies.


Measurement
Resources and tools for understanding audience metrics, including post-analysis guidelines and reporting support.



Ad Spend & Analytics
Dig into the dollars behind local broadcast advertising. This section highlights TVB’s reports, tools, and third-party data partnerships that break down national and market-level ad spend, political campaign allocations, revenue trends, and more.







Programming
Explore programming trends and strategies that drive results across different broadcast categories.


TV Basics
TV Basics is a quick reference guide to measurement, trends, and ranker statistics available on the TVB website. Connect to the information you need, when you need it.
Jump To A Topic
Planning & Buying
Quickly access key resources on TV advertising trends, placement strategies, and audience behavior to support smarter media planning and buying decisions.
- Commercial Television Stations
- DVR Trends
- Over-The-Air Broadcast Television (OTA)
- 2024-2025 Monthly HUT/PUTs
- National TV Household Penetration Trends
- Latest Monthly Top 100 – A18-49
- Latest Monthly Top 100 – A25-54
- Syndication – Adults 18+ and 25-54
- Syndication – Women 18+ and 25-54
- Top A25-54 Syndicated Programs
- Top P2+ Sports
- Top Sports and Specials Tracks
- TV Activity by Commercial Length
- TVB Insights Weekly TV Performance Metrics
- Broadcast Calendar & Nielsen Survey Dates
- Research 101
- Dayparts Code
- Glossary
National & Local Planning Tools
Find tools that connect national insights with local market data, helping you plan campaigns that perform at every level.
Government Data Resources/Indicators
Reference trusted government data such as the U.S. Census and Consumer Price Index to guide forecasts and understand consumer trends.
Sports Reports
Stay up to date on pro teams, top programs, and audience engagement trends in sports — a high-value area for advertisers.
How to Execute Co-Op Campaigns
Walk through the fundamentals of executing co-op campaigns and decoding co-op plans. With straightforward guidance and a supporting PowerPoint, you’ll learn how to maximize manufacturer contributions and navigate key co-op terms with confidence. File is available to members only—sign up here for access.
Additional Studies & Metrics
Access specialized studies on political spending, digital performance, buying power, and more for deeper insights into advertising effectiveness. Files will appear when logged in, as these files are available to members only—sign up here to access them.
Research Content Updates | Q2 2026
A digest for TVB members of what is new and what has been updated in the research area of the website. View the latest below.
New Content
- 2026 Media & Conversations Study
TVB’s study on the influence of media on daily conversations. Among the key findings is that broadcast TV news assets are critical in sparking and supporting conversations about news, weather, sports, traffic, and politics. - Political Spotlight
Features an in-depth look at the competitive political races at the state level, including competitive status for the 2026 Senate and Gubernatorial races. Two new states, California and Texas, have been added. - CIMM x TVB Guidelines for Local TV and Video Currency Measurement
CIMM & TVB released a set of tools designed to clarify what buyers, sellers, and measurement providers should seek from currency measurement solutions intended for the local TV and local video marketplace. - 2026 Back-to-School and College Report
TVB’s 2026 Back-to-School & College Report highlights the importance of TV advertising, particularly local broadcast TV, in influencing both online and in-store purchase decisions to best reach back-to-school and college consumers. - 2026 Mother’s Day Report
The 2026 Mother’s Day Report demonstrates the importance of local broadcast TV in targeting Mother’s Day shoppers regardless of category, geography, or whether shopping in-store or online.
Updated Content
- Ad Spend & Analytics
All ad spending and analytics modules have been updated with full year 2025 spending data including: Ad Dollar Allocation, Spot TV Revenue Market Rank, Media Spending by Total and by Market, Key Industry Breakouts and Top 25 Spot Categories and Advertisers. CMAG has also been updated with full year 2025 political spending. - Sports & Specials
Updated Comscore performance tracks for the Grammy Awards and the Super Bowl, as well as Nielsen performance tracks for the Grammy Awards. - TVB Guide to the 2026 Elections
Some updates to the U.S. House of Representatives races have been added. - TV Basics
Quickly access key resources on TV ad trends, placement strategies, and audience behavior to support smarter planning & buying decisions. 2024-2025 Monthly HUT/PUTS updated.
TIP Transaction Standard
The TIP (Television Interface Practices) Transaction Standard brings the TV industry together to simplify and automate the buying and selling of local broadcast advertising.
Developed collaboratively by broadcasters, agencies, and technology partners, TIP creates a unified framework that enhances efficiency, reduces manual work, and enables seamless communication across systems. Explore the resources below to learn more about the initiative and its benefits for buyers and sellers.