
2020 Voters Media Usage Study: South Carolina
In February 2020, TVB commissioned Dynata to conduct a study of registered voters in South Carolina to gain an understanding of media usage, and attitudes toward traditional and digital platforms. 1,000 respondents were surveyed and to qualify, each respondent had to be a registered voter and had to have been exposed to any of over 20 media (traditional or digital) in the prior 24-hour period.
Download study | Press Release
Key findings:
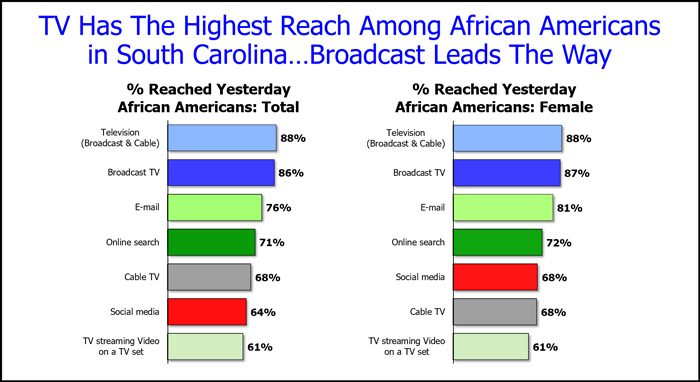
- Among South Carolina’s registered voters, broadcast TV has the highest reach of all ad-supported platforms.
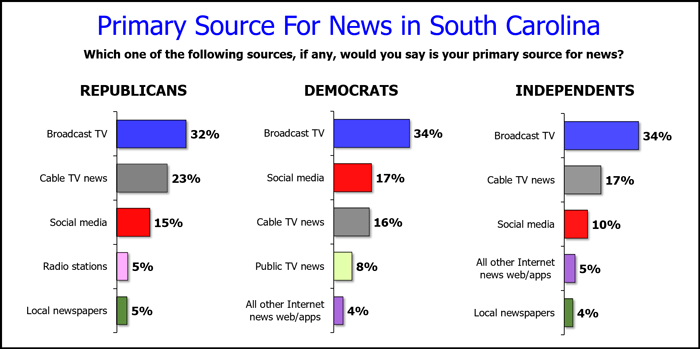
- The primary source for news among South Carolina’s registered voters is broadcast TV, while cable TV news and social media were a distant second and third.
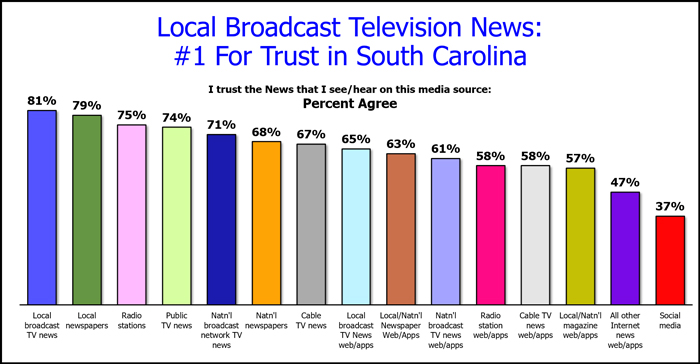
- 81 percent of registered voters view local broadcast TV as the most trusted media source for news.
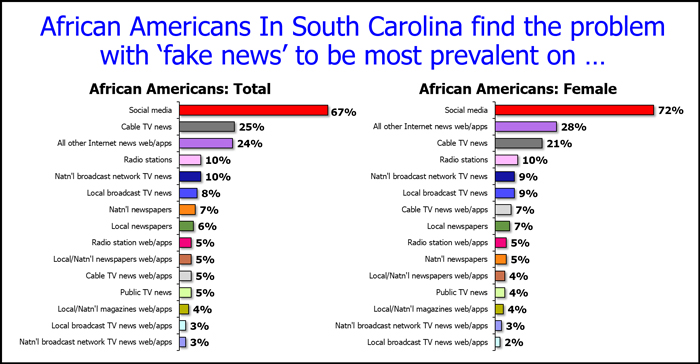
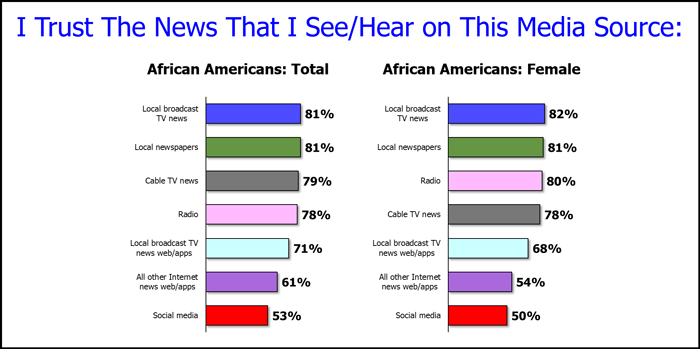
- There is strong concern among African Americans about fake news on social media. When asked about trust in the news seen/heard on a multitude of media platforms, only 53 percent of African Americans trusted news reported on social media while local broadcast TV and local newspapers both captured 81 percent of trust.
- Local broadcast TV news is the most trusted media source for news among all African Americans and African American women in South Carolina.
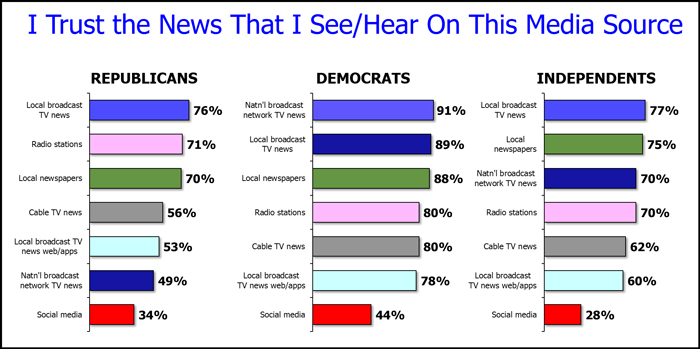
- Television also has the highest reach among major political parties, with broadcast leading the way for Democrats and Republicans. For Independents, social media, radio and cable TV fell well below other media platforms when it came to reach and trust.
- Female registered voters in South Carolina trust local broadcast TV news more than news on cable TV, radio, and social media.
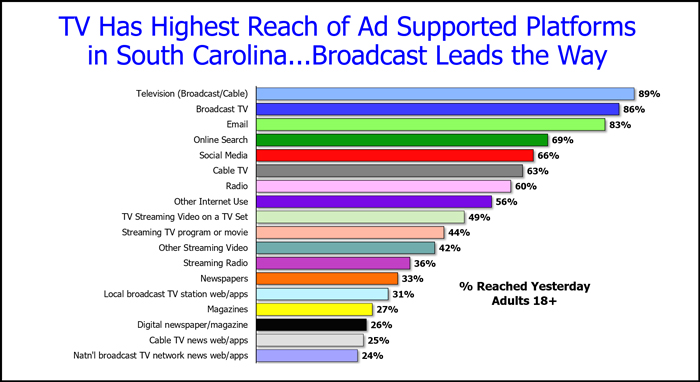
Source: Dynata 2020 South Carolina Registered Voter media survey Persons 18+. N = 1000
Source: Dynata 2020 South Carolina Registered Voter media survey Persons 18+. N = 1000
Q6 Agree Strongly or Agree Somewhat. For each source, please indicate the extent to which you agree or disagree with the following statement: I trust the News that I see/hear on this media source.
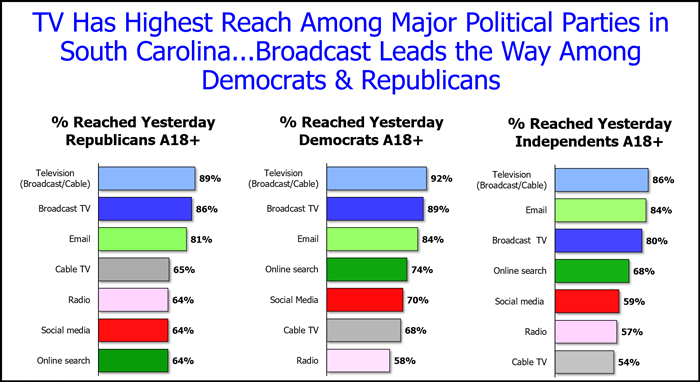
Source: Dynata 2020 South Carolina Registered Voter media survey Republicans, N = 348; Democrats, N = 396; Independents, N = 210
Source: Dynata 2020 South Carolina Registered Voter media survey Republicans, N = 348; Democrats, N = 396; Independents, N = 210
Q5 – Which one of the following sources, if any, would you say is your primary source for news?
Source: Dynata 2020 South Carolina Registered Voter media survey Republicans, N = 348; Democrats, N = 396; Independents, N = 210
Q6 Agree Strongly or Agree Somewhat. For each source, please indicate the extent to which you agree or disagree with the following statement: I trust the News that I see/hear on this media source.
Source: Dynata 2020 South Carolina Registered Voter media survey African Americans 18+ Total, N = 237; Female, N = 136
Source: Dynata 2020 South Carolina Registered Voter media survey African Americans 18+ Total, N = 237; Female, N = 136
Q7 I find the problem with “fake news” to be most prevalent on…
Source: Dynata 2020 South Carolina Registered Voter media survey African Americans 18+ Total, N = 231; Female, N = 125
Q6 Agree Strongly or Agree Somewhat. For each source, please indicate the extent to which you agree or disagree with the following statement: I trust the News that I see/hear on this media source.
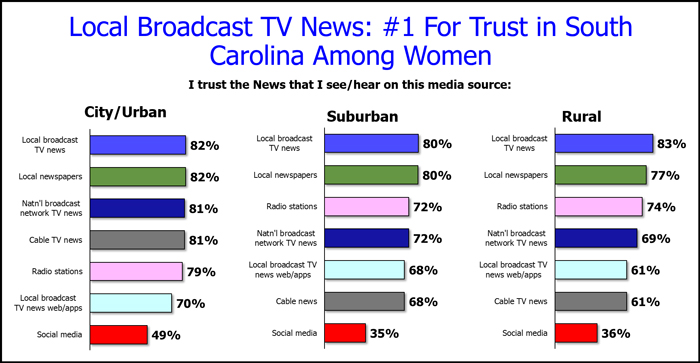
Source: Dynata 2020 South Carolina Registered Voter media survey W18+ Urban/City, N = 100; Suburban, N = 275; Rural, N = 180
Q6 Agree Strongly or Agree Somewhat. For each source, please indicate the extent to which you agree or disagree with the following statement: I trust the News that I see/hear on this media source.